
Visibility solutions across
the supply chain life cycle
Your single source of truth for
everything service, vessel,
schedule or port related
Global liner networks
A powerful mapping of every liner service globally
Vessel schedules
Past and future vessel deployments & schedules
Port coverage & transit times
Look up and compare direct port pair products
Blank Sailings Tracker
Which departures and arrivals have been cancelled, and when ?
Vessel on-time reliability
50% of all container vessels arrive more than 8 hrs late
Ports & terminals
Port capacities, throughputs & equity ownerships
Trade Capacity Index
Actual deployed capacity in all trade lanes and into all ports, incl market shares
Vessel forecasts
Constantly-updated ETAs for ports, vessels, and services
Emission: Possible (coming)
Understand and benchmark your GHG emissions

Global liner networks
A powerful mapping of every liner service globally, whether deep sea, short sea or feeder. Alliance, operating partners and slot charterers, including - finally - consistent service names.
Vessels deployed and weekly capacity. Full schedule details, including terminals called, ETA/ETDs, nautical distances, and speeds.
eeSea Blank Sailings Tracker
In the wake Covid-19, managing the market supply of vessel capacity became a hot topic. Vessel arrival performance and cargo deliveries are down, freight rates are up and authorities are getting involved.
eeSea’s Blank Sailings Tracker helps you maintain an overview of what has been cancelled and when - by trade or port.
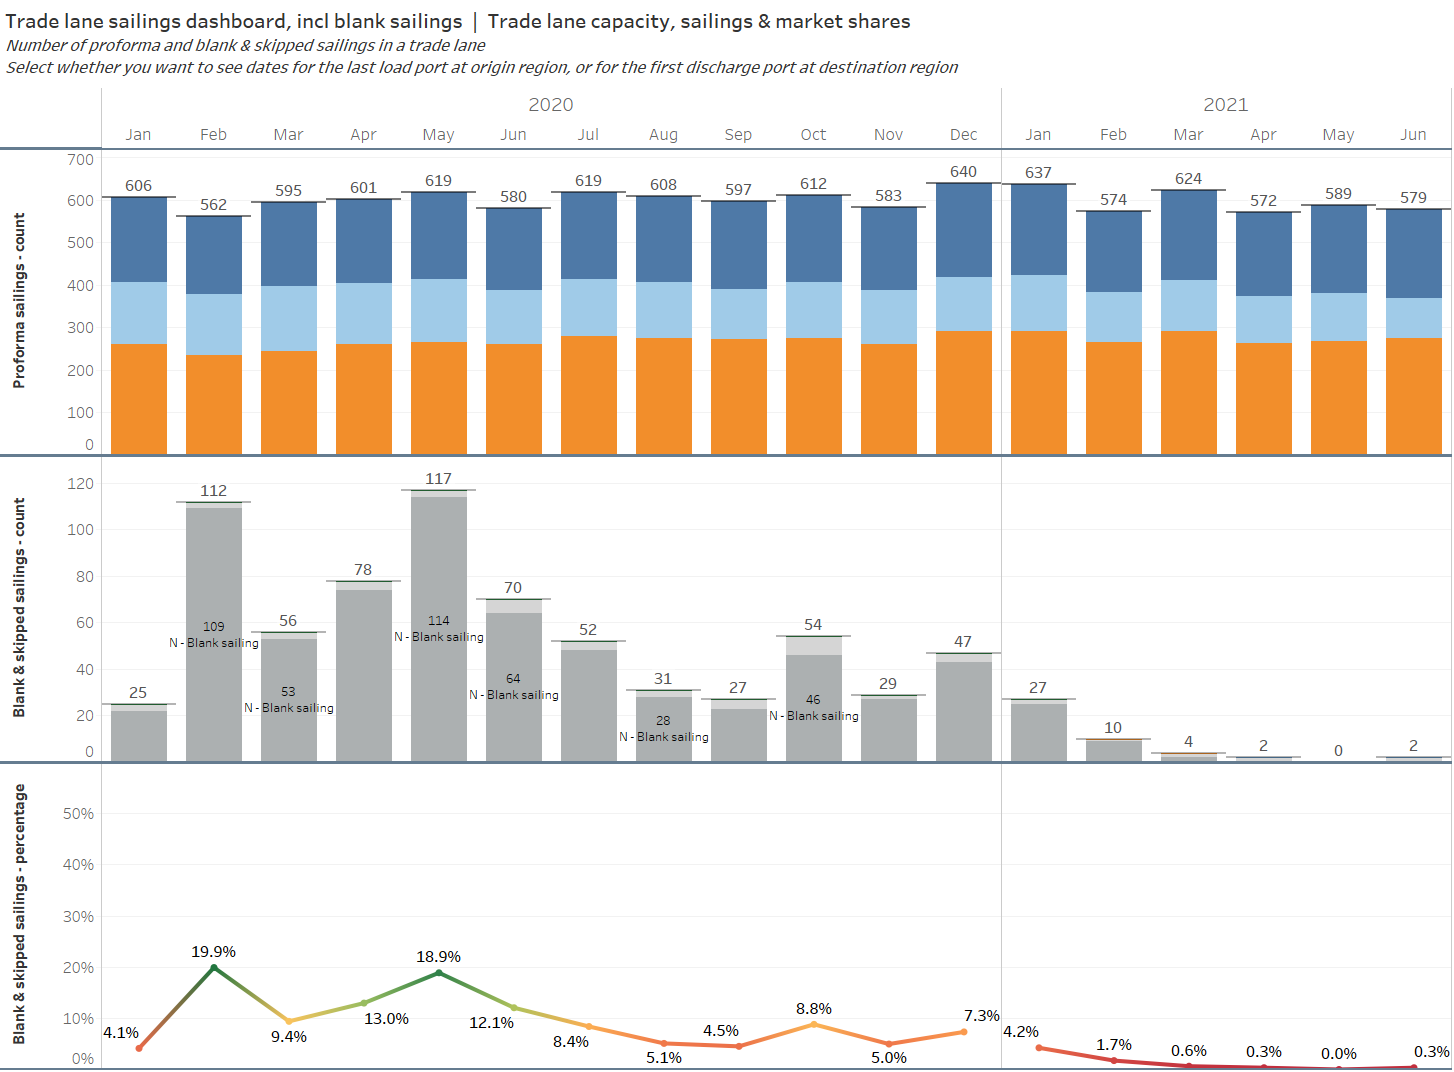
eeSea Trade Capacity Index
Global supply chains are heavily impacted by vessel supply & cargo demand - blank sailings, delays, freight rates, they’re all connected
And eeSea has the supply side covered for you. Our Trade Capacity Index tracks the actual deployed vessel capacity in all trade lanes, into all ports.


Continuously tracking all container vessels and their service deployment, allows us to formulate standardized vessel schedules, incl berthing windows, port pairs, and useful voyage codes.
Vessel schedules

Vessel schedule reliability
Drawing on geo-fenced AIS data to deduce vessel arrivals and departures, we match some 10,000 arrival and departure data points per month against their expected proforma arrival. The resulting delay or early arrival is measured in minutes and published immediately.

Vessel Forecasts
eeSea Vessel Forecasts track and forecast vessel schedules in real-time, providing constantly-updated ETAs for given ports, vessels, and services.
Port-to-port transit times
Based on our detailed mapping of liner proforma schedules, the transit time module allows you to look up and eeSealy compare direct port pair products.
View, sort, and filter by from/to country, coastal region and port, transit time, or by service, alliance, or carrier. Find and compare the port pairs where your port or carrier offers the best transit times.

Ports & Terminals
We’ve mapped all container ports and terminals globally, including their liner networks, throughputs, capacities, and equity ownerships.

Emission: Possible
The global container supply chain handles 95% of all manufactured goods - but it’s also responsible for an estimated 2.5-4% of all greenhouse gas emissions.
Understanding and ultimately reducing fuel consumption and emissions is paramount for our world of tomorrow - and thus for all stakeholders in the supply chain.
Our Emissions Possible Index helps you benchmark your own emissions by trade, carrier, or down to vessel/container level.
…and it doesn’t end here.
If you’d like a demo, were wondering if we could customize a solution for you,
or simply want to talk - please don’t hesitate.