
eeSea Trade Capacity Index
Global supply chains are heavily impacted by vessel supply & cargo demand - blank sailings, delays, freight rates, they’re all connected.
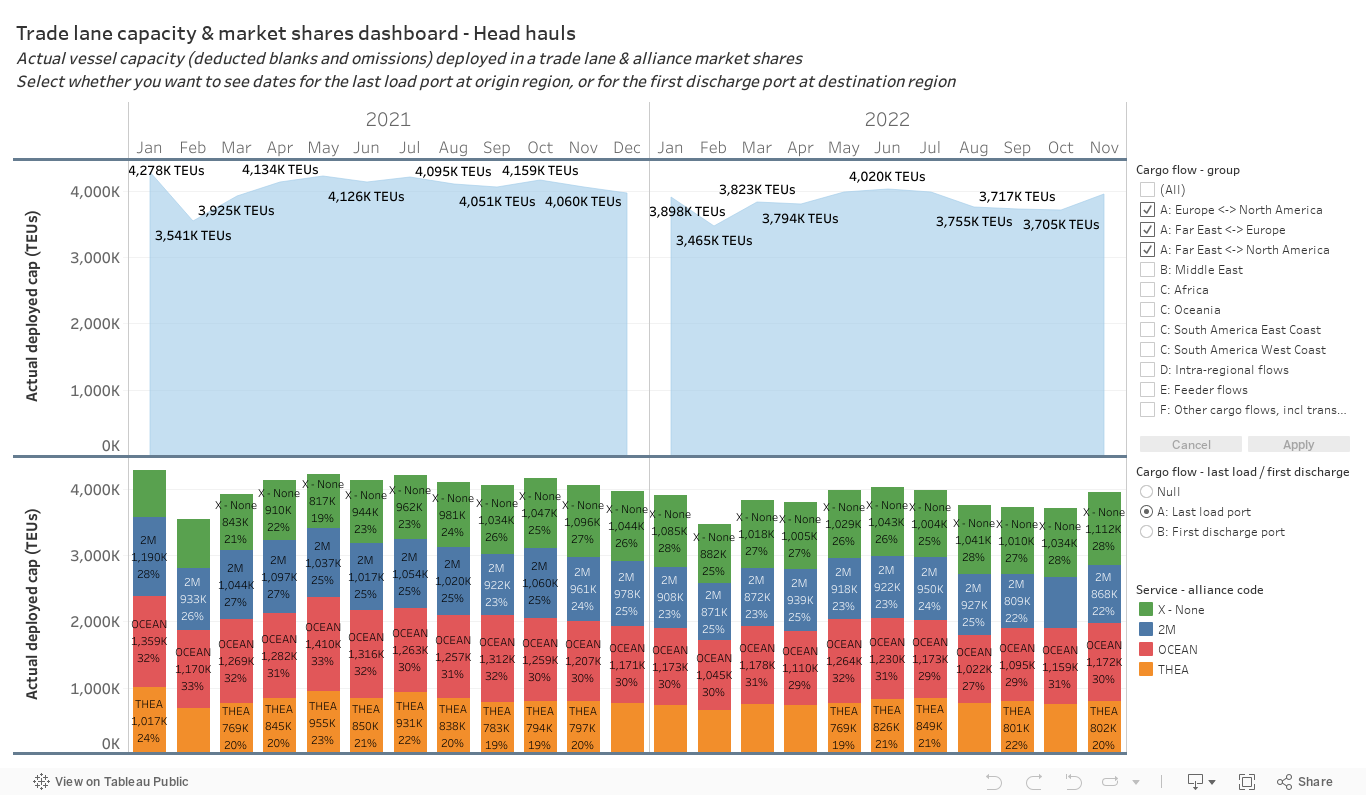
eeSea has the supply side covered for you. Our Trade Capacity Index tracks the actual deployed vessel capacity in all trade lanes, into all ports.
Interactive dashboard
Try it out !
How to use
The filters on the right can be applied to show your desired trade lane, and whether you want to see origin or destination region months.
Terms of use
You are welcome to use the information as it is or broken down - but only against proper reference. This reference must include the name eeSea AND a URL link to this specific page - regardless of whether the usage is internal, external or public.
Making the Data work for you.
eeSea’s trade capacity data is compiled at the port call level, which allows us to aggregate up to any desired category: trade lane, alliance, service, vessel, port, country, or anything in between.
Check out these sample views:


Additional information & subscription
Deeper insights and more granular data are available with a subscription:
TEU capacity & sailings - proforma, actual and blanked
By trade lane - or port, country, region
More granular trade lanes - eg split by NEUR/MED, ECNA/WCNA, ISC/APG/RSE, WAF/SAF/EAF
By alliance, service, VSA partner, vessel operator
By date, week, month, quarter, year
Trade lane capacity is closely related to blank sailings
“We use eeSea's combined Blank Sailings Tracker and Trade Capacity Index to better gauge chassis demand and as an additional tool to support our planning to meet our customers needs at US port gateways.”
— Ron Widdows
CEO, Flexivan